
In the dataset Crypto_coins_dataset (2010–2025), we analyze three mainstream cryptocurrencies — Bitcoin (BTC), Ethereum (ETH), and Binance Coin (BNB) — within the context of a highly dynamic financial market.
The dataset captures various market activities, including price over time (open, close, high, low), trading volume, and market capitalization.
This project explores trends, volatility, stationarity, and other time-series characteristics of the cryptocurrency market through data visualization, statistical modeling, risk analysis, and benchmarking.
The scope of analysis is as follows:
1. Daily Return Dynamics
- Distributional properties and summary statistics
2. Stationarity and Return Transformation
- ADF, KPSS, PP tests
- Motivation for log returns
3. Volatility Modeling: ARIMA + GARCH
- ARIMA-GARCH specification and diagnostics
- Forecast vs realized volatility
4. Volatility Regime Analysis
- Rolling volatility and clustering
- Regime classification and persistence
- Regime transition visualization
5. Drawdown and Crash Risk
- Maximum drawdowns and recovery behavior
- Extreme loss frequency
- Crash risk across volatility regimes
6. Tail Risk and Extreme Behavior
- Skewness, kurtosis, and fat tails
- QQ plot diagnostics
- Risk management implications
7. Market Capitalization and Structure
- Market cap growth and dominance
- Concentration and long-tail dynamics
8. Benchmarking Within Crypto Markets
- Risk-return trade-offs across major assets
- BTC as a market benchmark
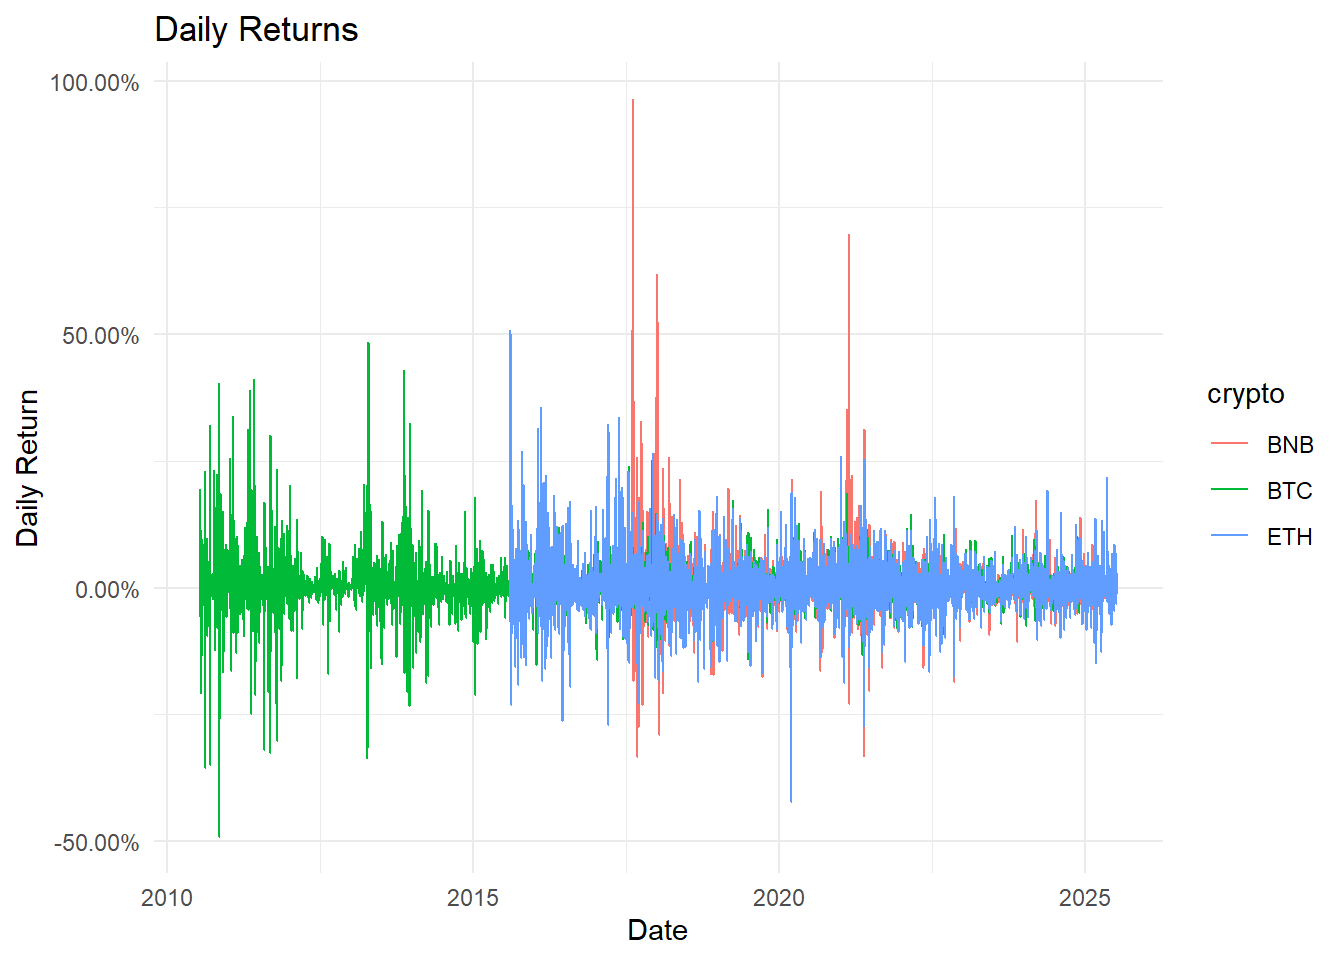
To begin, we provide an overview of the daily returns for each cryptocurrency. This allows us to gain a rough understanding of their historical activity and general performance trends from the past up to the present.
Compare today's price with yesterday's price to see how much more or less it is today.
We tested whether daily returns are statistically stable over time using three common stationarity tests:
- Augmented Dickey-Fuller (ADF)
- Kwiatkowski–Phillips–Schmidt–Shin (KPSS)
- Phillips–Perron (PP)
The results show that returns generally hover around a consistent mean, as indicated by the ADF and PP tests, but their volatility can vary, as suggested by the KPSS test.
In simple terms, the prices are not “randomly drifting” but can have periods of higher or lower fluctuation. This behavior is typical in cryptocurrency markets and confirms that time-series models like ARIMA and GARCH are appropriate for capturing both the trend and volatility in daily returns.
Log returns is a way to measure percentage changes in a “fair” scale that adds up naturally over multiple days. It’s like measuring height in centimeters instead of inches: calculations become easier and more consistent.
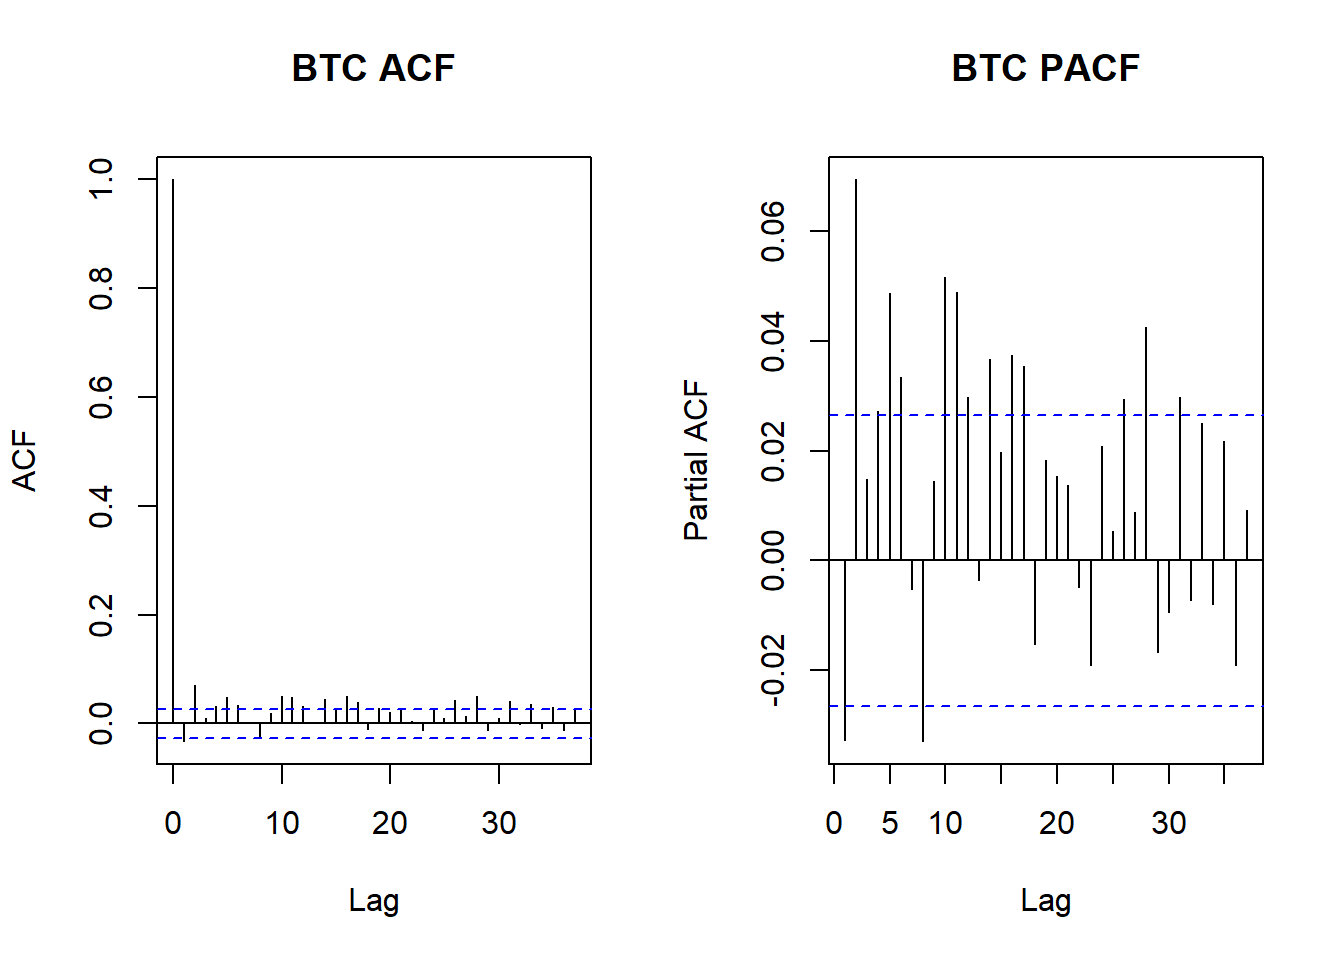
As an exploratory step, we examine autocorrelation function (ACF) and partial autocorrelation function (PACF) plots of daily returns. These visual tools show whether returns are systematically related to their own past values. The results suggest limited linear dependence in returns, which is typical for financial markets and supports the use of time-series models focused on volatility rather than predictable price movements.
ACF shows how strongly today’s return is related to returns from several days ago (1 day ago, 2 days ago, 3 days ago, etc.), while PACF shows the direct relationship between today’s return and a specific past day, after removing the effects of the days in between.
Think of it as:
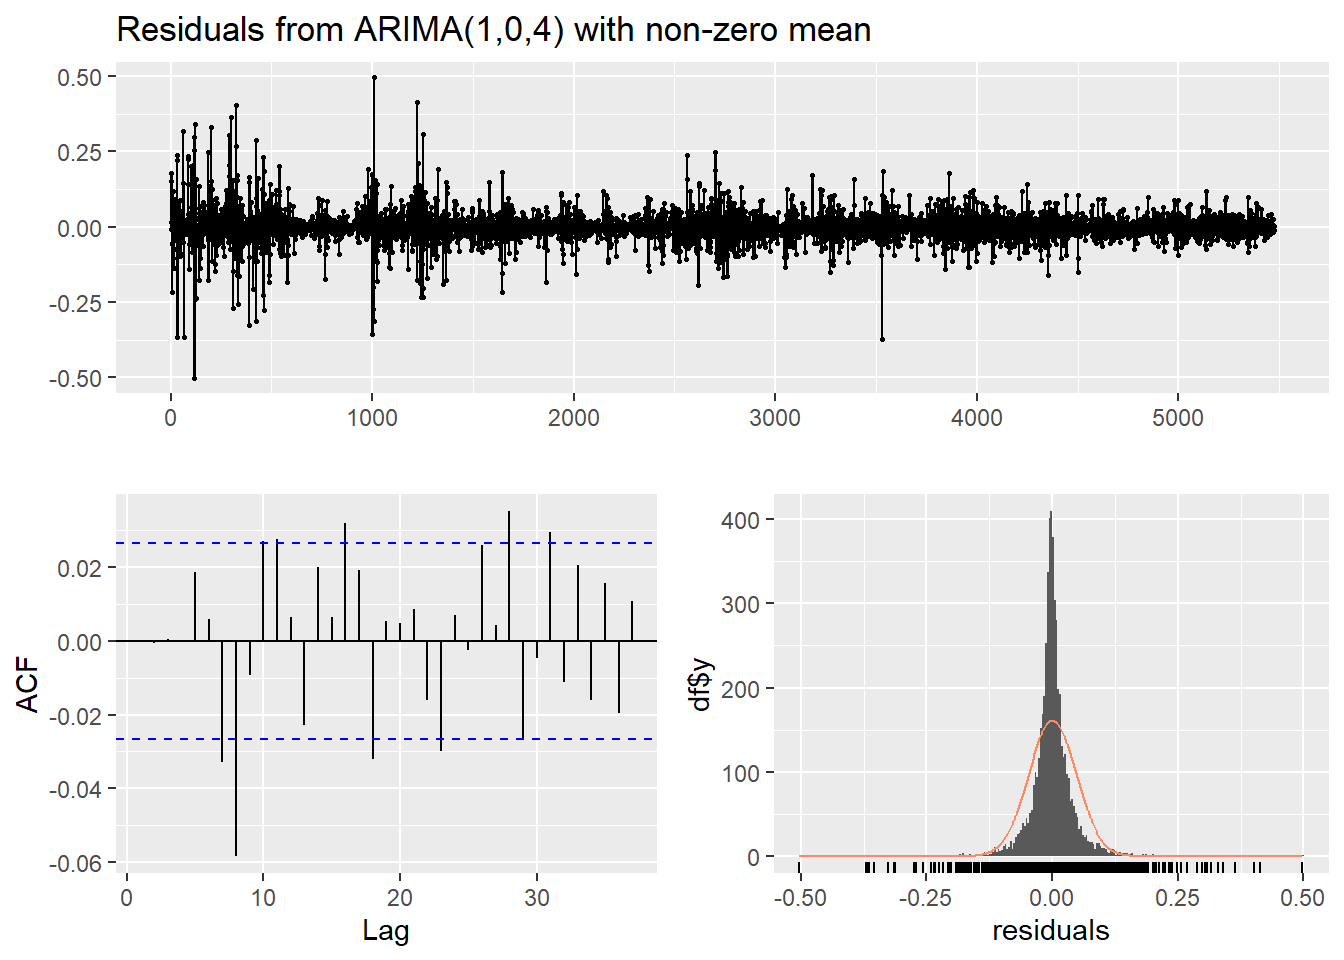
📈 1. Residuals over time (top plot)
The residuals fluctuate randomly around zero over time, suggesting that the model has captured the main structure in the data and no systematic pattern remains.
📉 2. ACF of residuals (bottom-left plot)
The residuals show no meaningful correlation across time, which means the model has removed predictable patterns from the return series.
📊 3. Histogram of residuals (bottom-right plot)
The distribution of residuals is centered around zero, indicating that the model does not consistently overestimate or underestimate returns.
To better capture the risk characteristics of Bitcoin returns, we applied a GARCH model, which is designed to model changing market volatility over time. The results show strong evidence of volatility clustering, meaning periods of high volatility tend to be followed by further high volatility, while calm periods tend to persist.
The model indicates that recent market shocks have a meaningful impact on short-term volatility, while longer-term volatility remains highly persistent. In addition, the return distribution exhibits heavier tails (shape ≈ 3) than a normal distribution, implying that extreme price movements occur more frequently than would be expected under standard assumptions.
Diagnostic tests suggest that the model successfully captures the main volatility dynamics, leaving little remaining structure in the residual variance. This confirms that the GARCH framework is well suited for modeling risk and uncertainty in cryptocurrency markets.
We estimate short-term market volatility using a 30-day rolling window of log returns.
Based on the historical distribution of volatility, each day is classified into low-, medium-, or high-volatility regimes.
This allows us to identify periods of calm markets versus periods of elevated risk and instability.
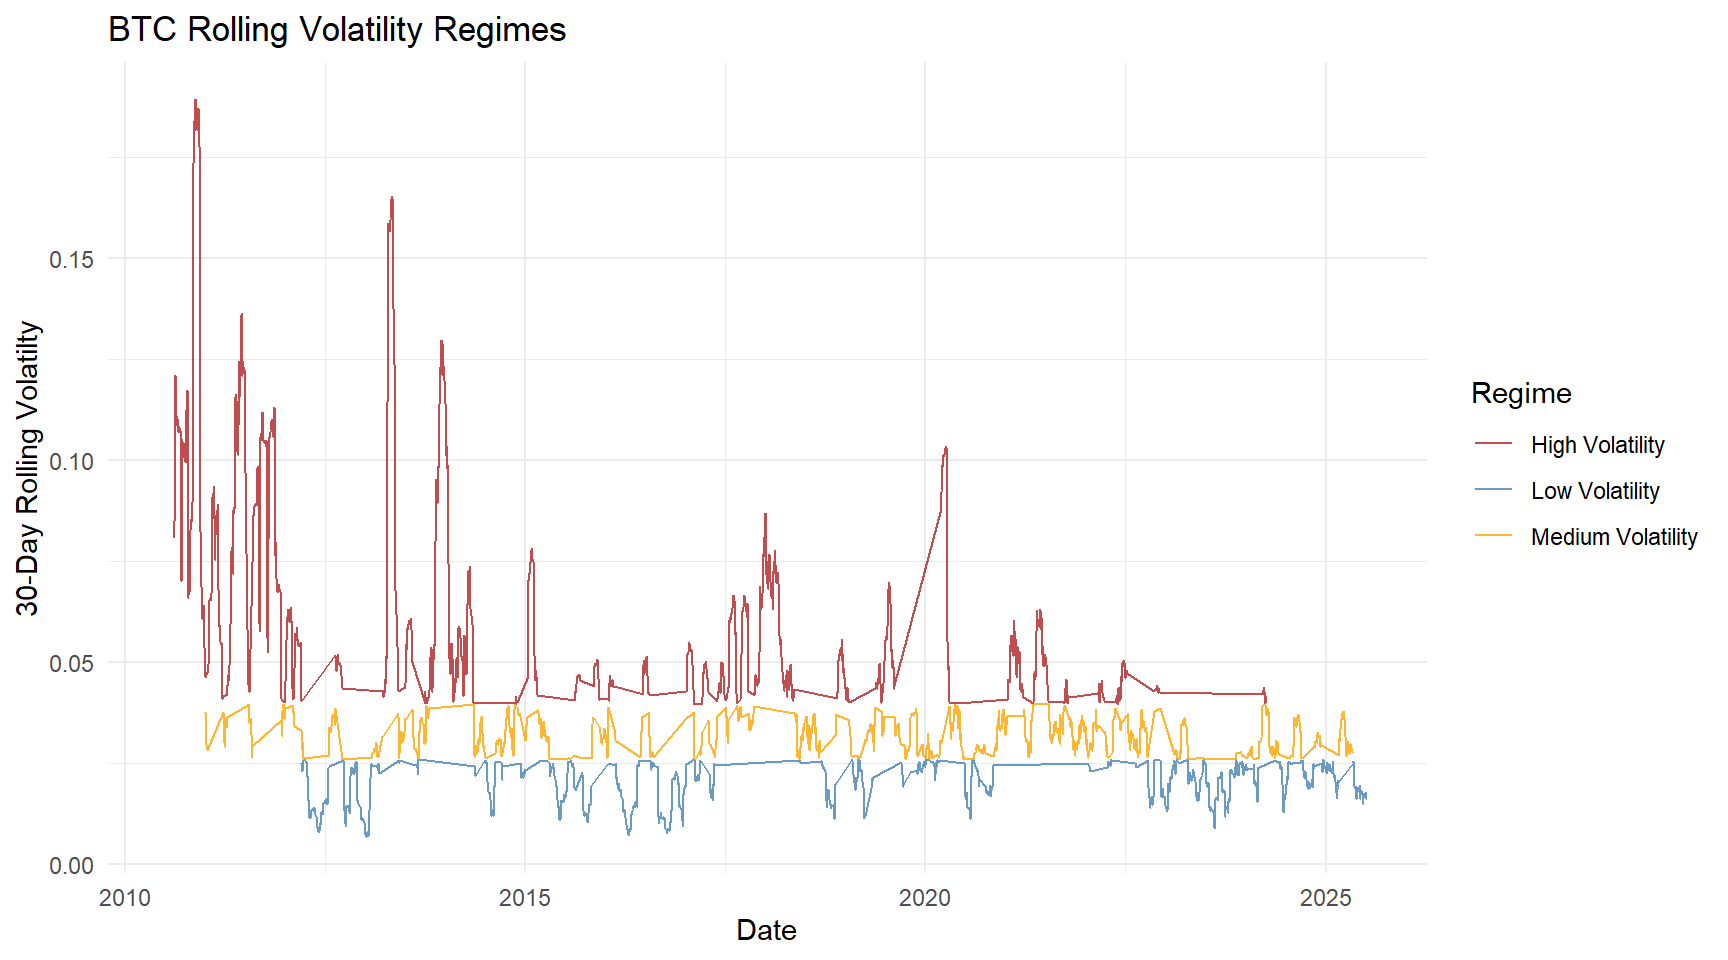
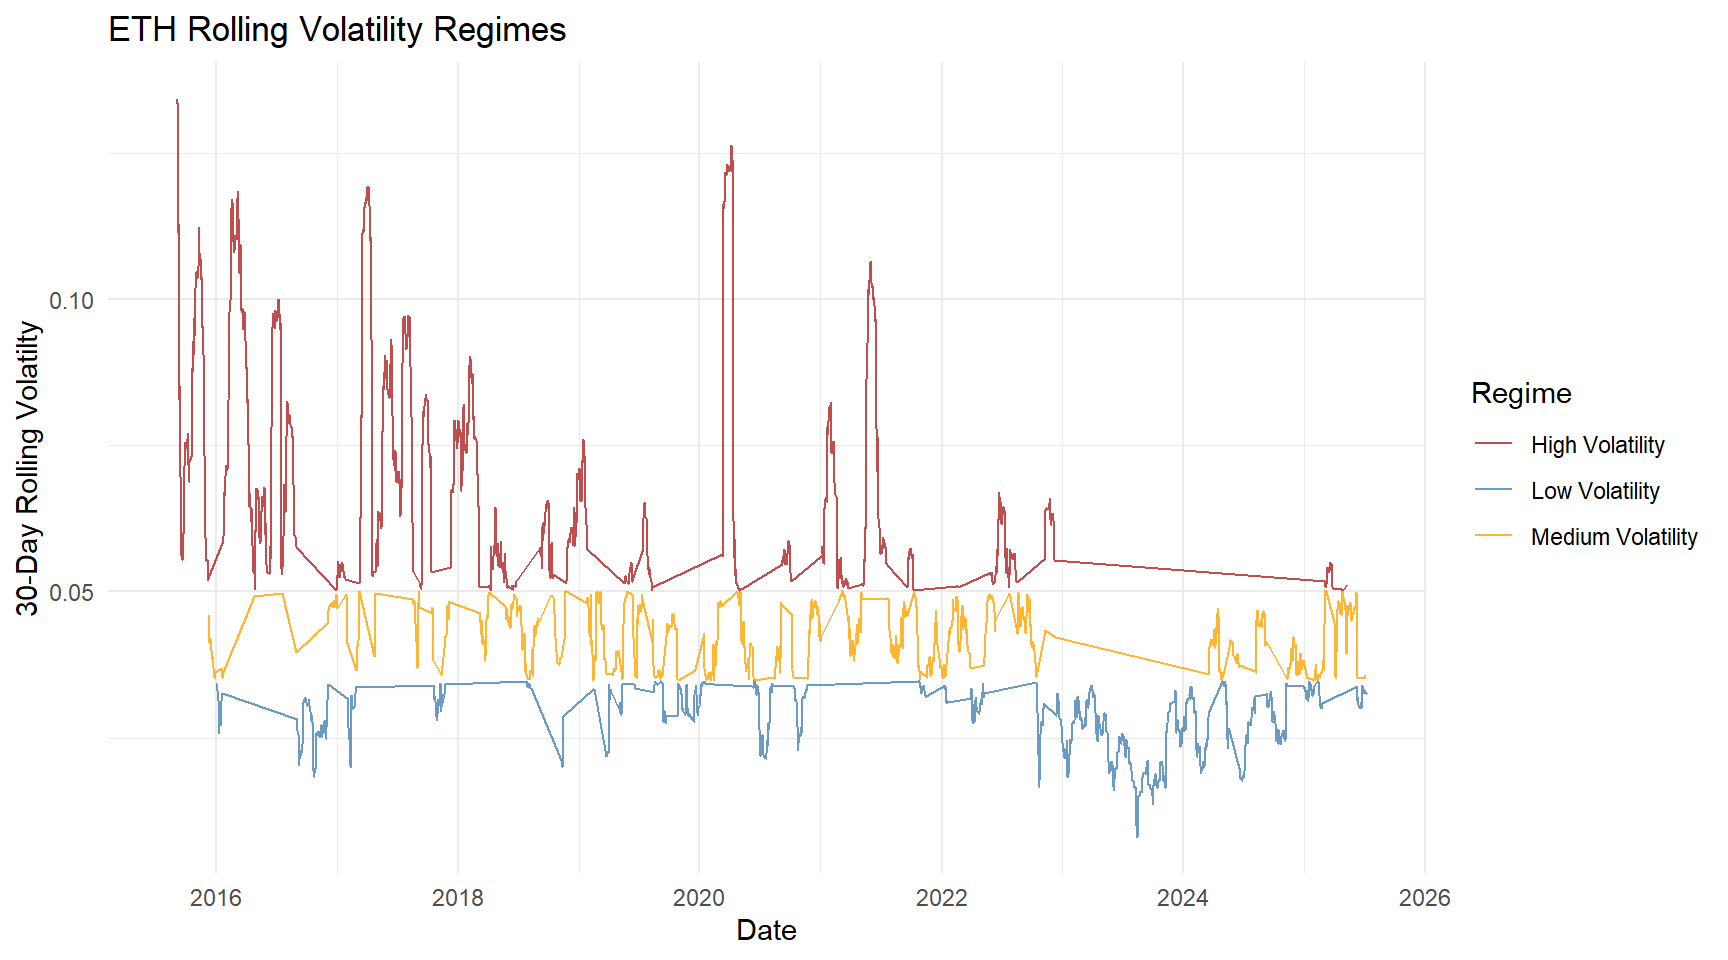
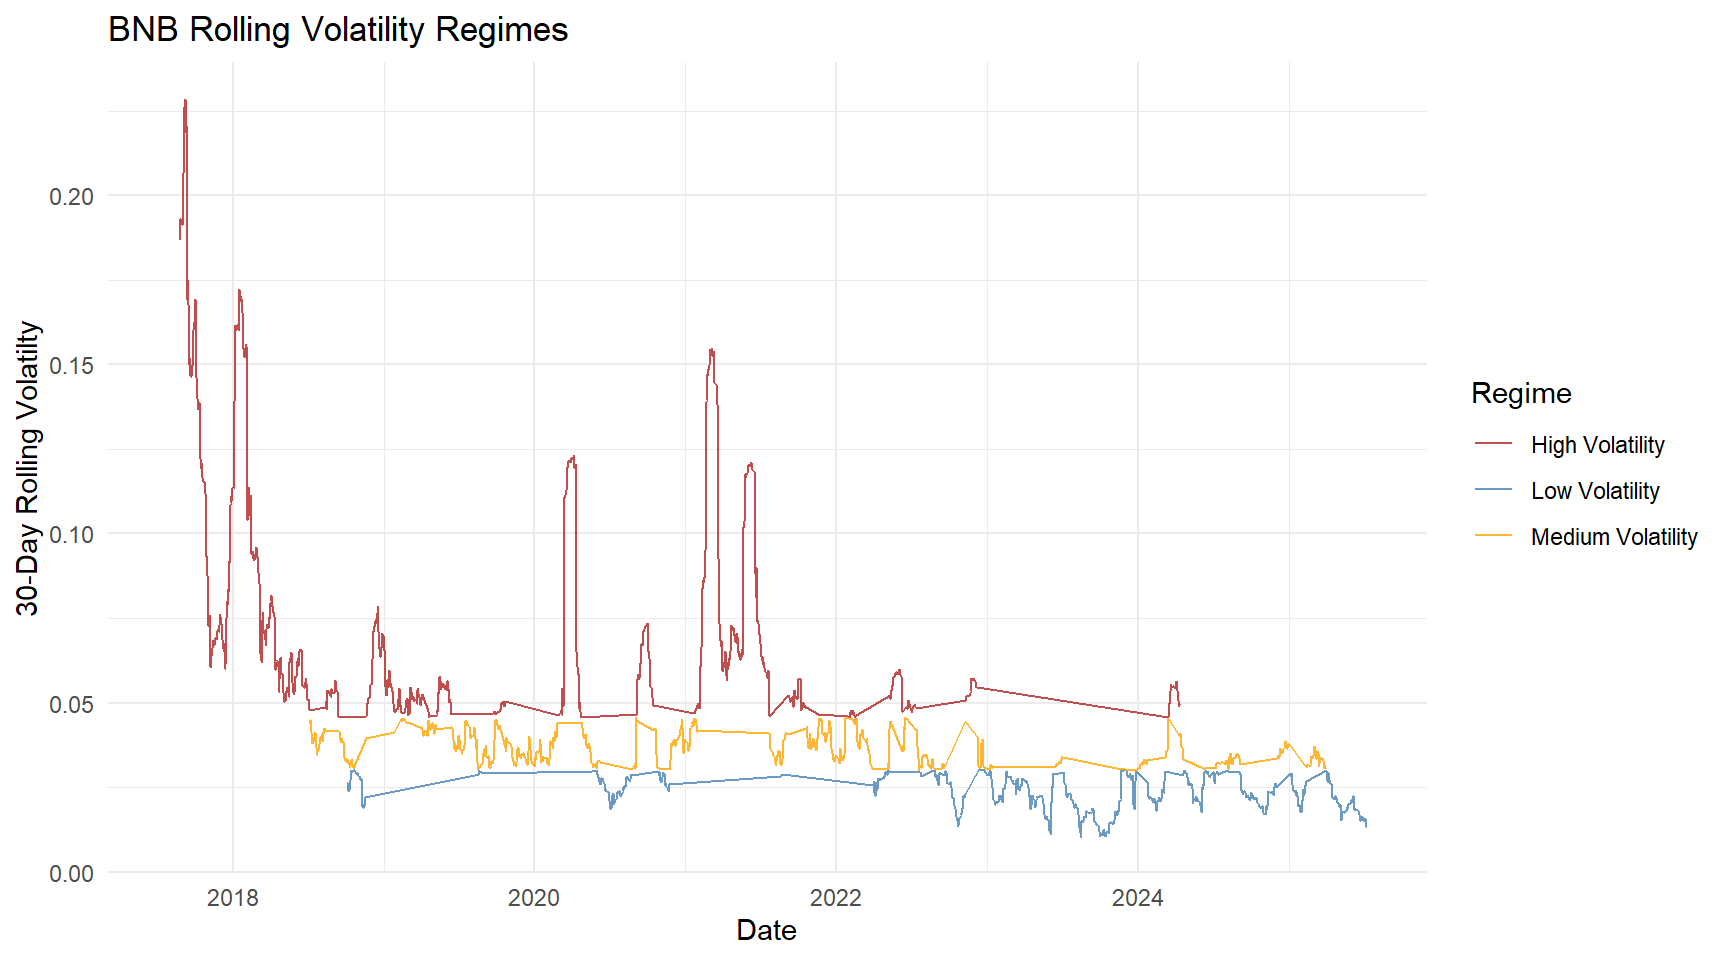
🔍Key Insights
This regime-based perspective provides a foundation for downstream risk analysis, including drawdown and tail risk assessments.
While volatility captures short-term fluctuations, it does not fully reflect the severity of downside risk faced by investors.
Drawdowns measure cumulative losses from peak to trough and provide a more intuitive representation of market crashes and recovery dynamics.
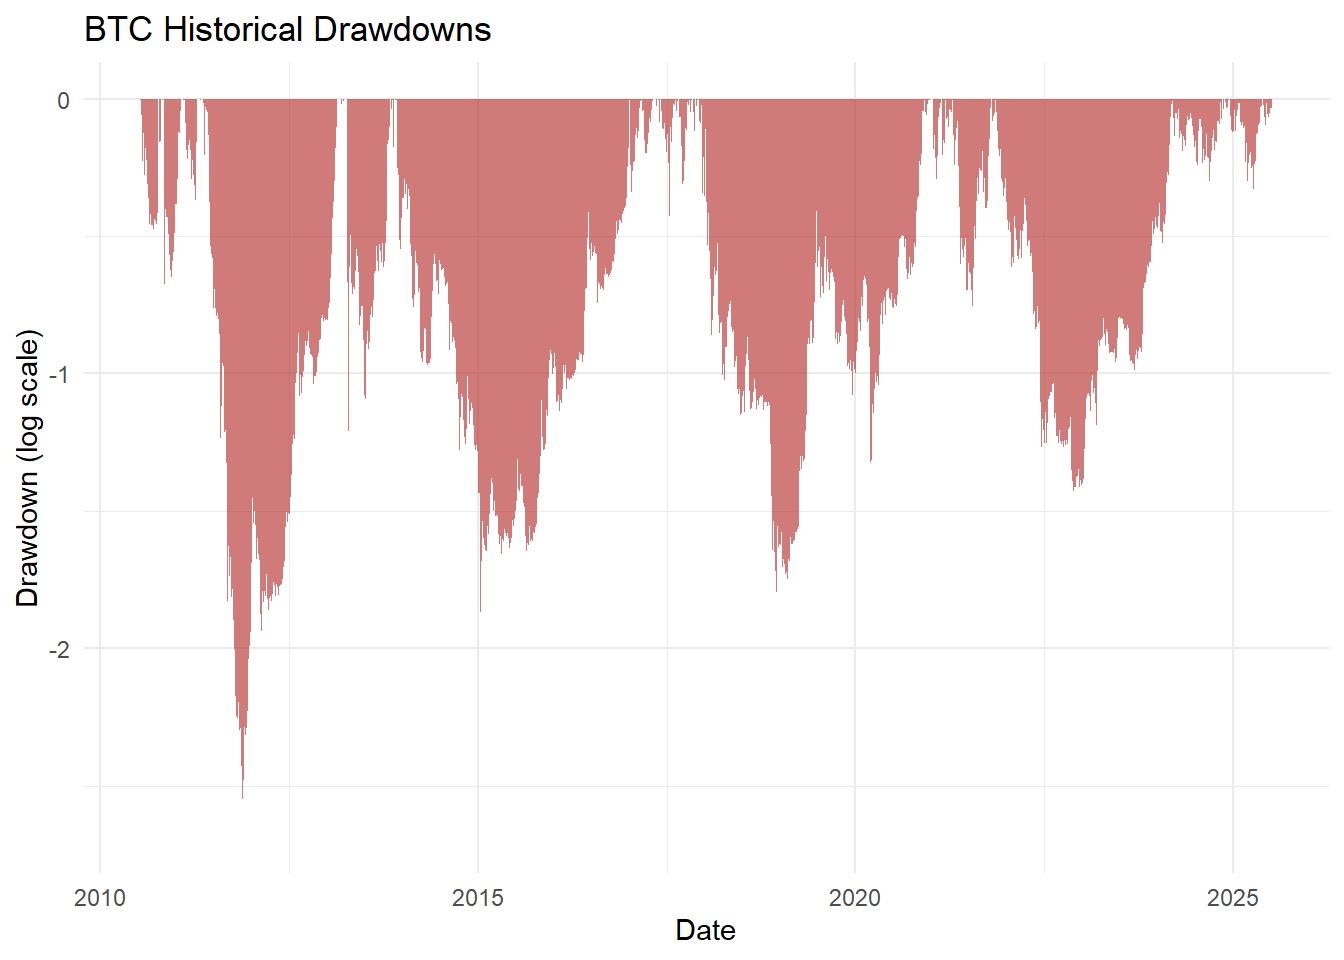
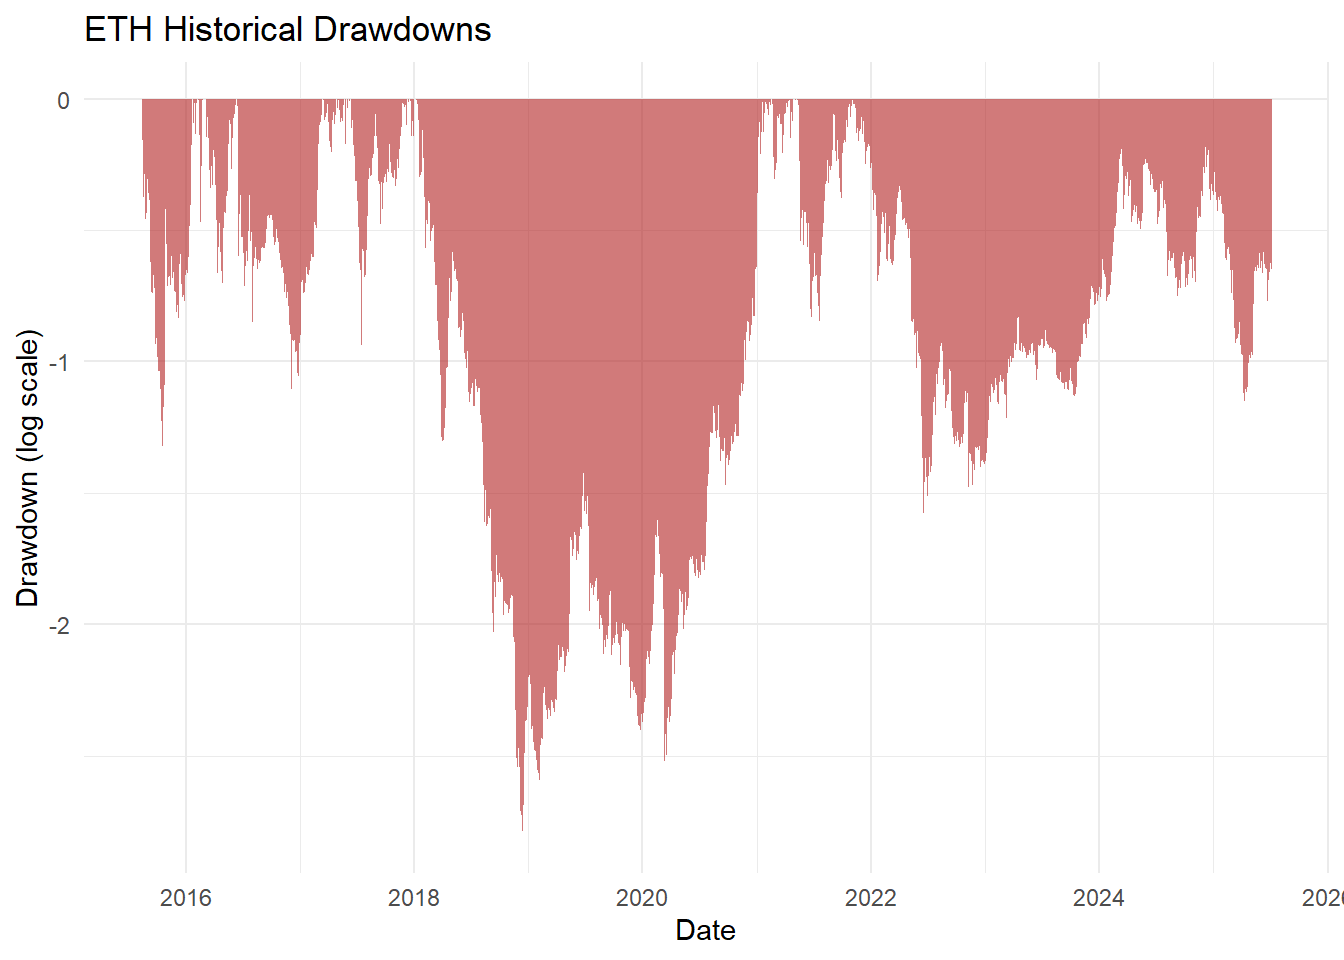
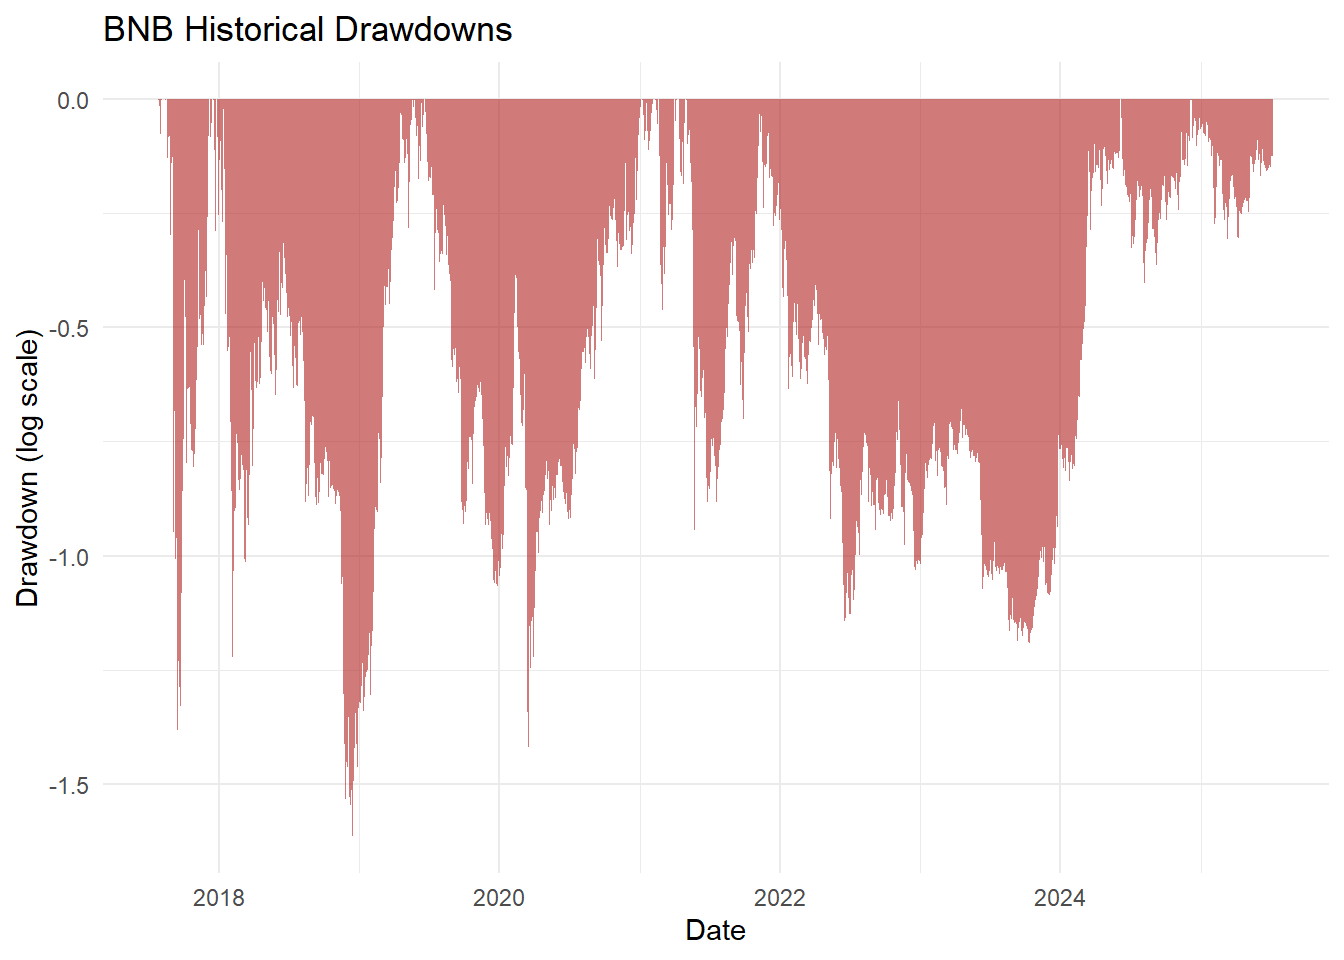
Maximum drawdown measures the worst loss an investor would have experienced if they bought at the highest point and sold at the lowest point before the price recovered.
Among the three assets, Ethereum experienced the most severe peak-to-trough loss, followed closely by Bitcoin. BNB showed a significantly smaller maximum drawdown, indicating comparatively better downside resilience during extreme market downturns.
Crash events are relatively rare across all three cryptocurrencies, occurring on roughly 2–3% of trading days. Ethereum exhibits the highest crash frequency, while Bitcoin and BNB experience slightly fewer extreme downside days.
💡Do crash events occur disproportionately during high-volatility regimes?
Crash events are far more likely during high-volatility periods. Although high-volatility regimes represent only a portion of the total sample, they account for the majority of crash days, with crash probabilities roughly higher than in calmer market conditions.
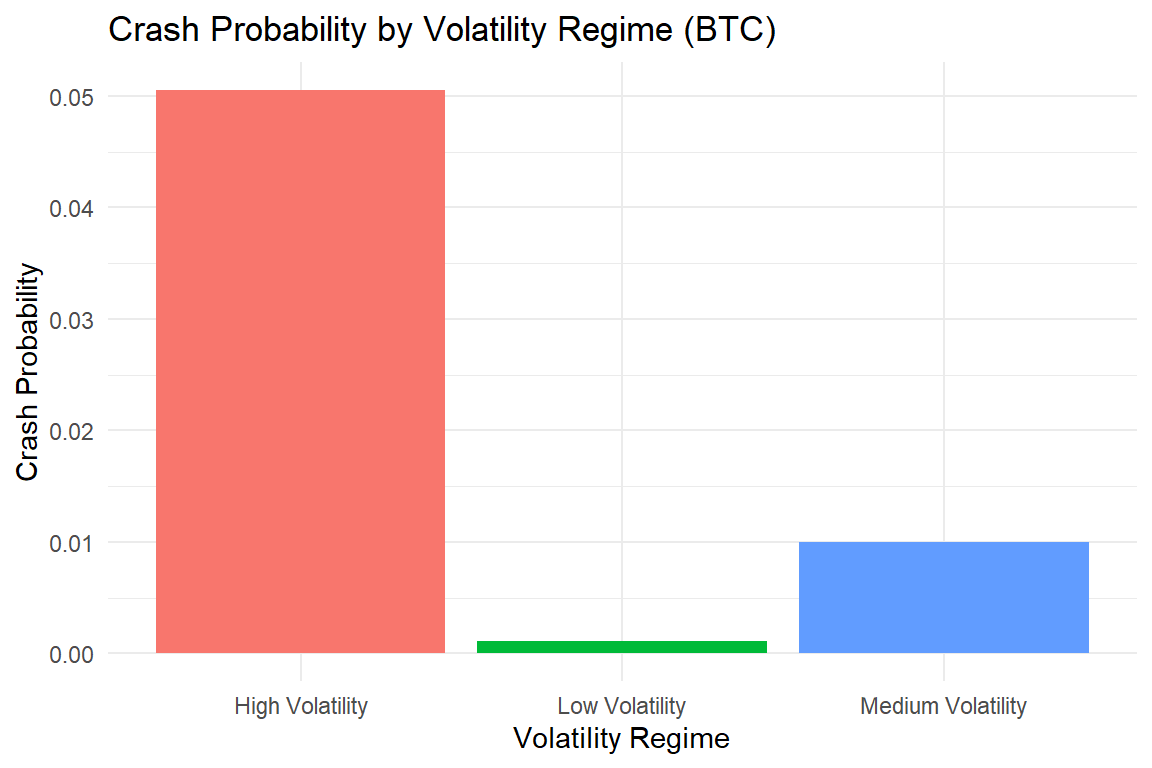
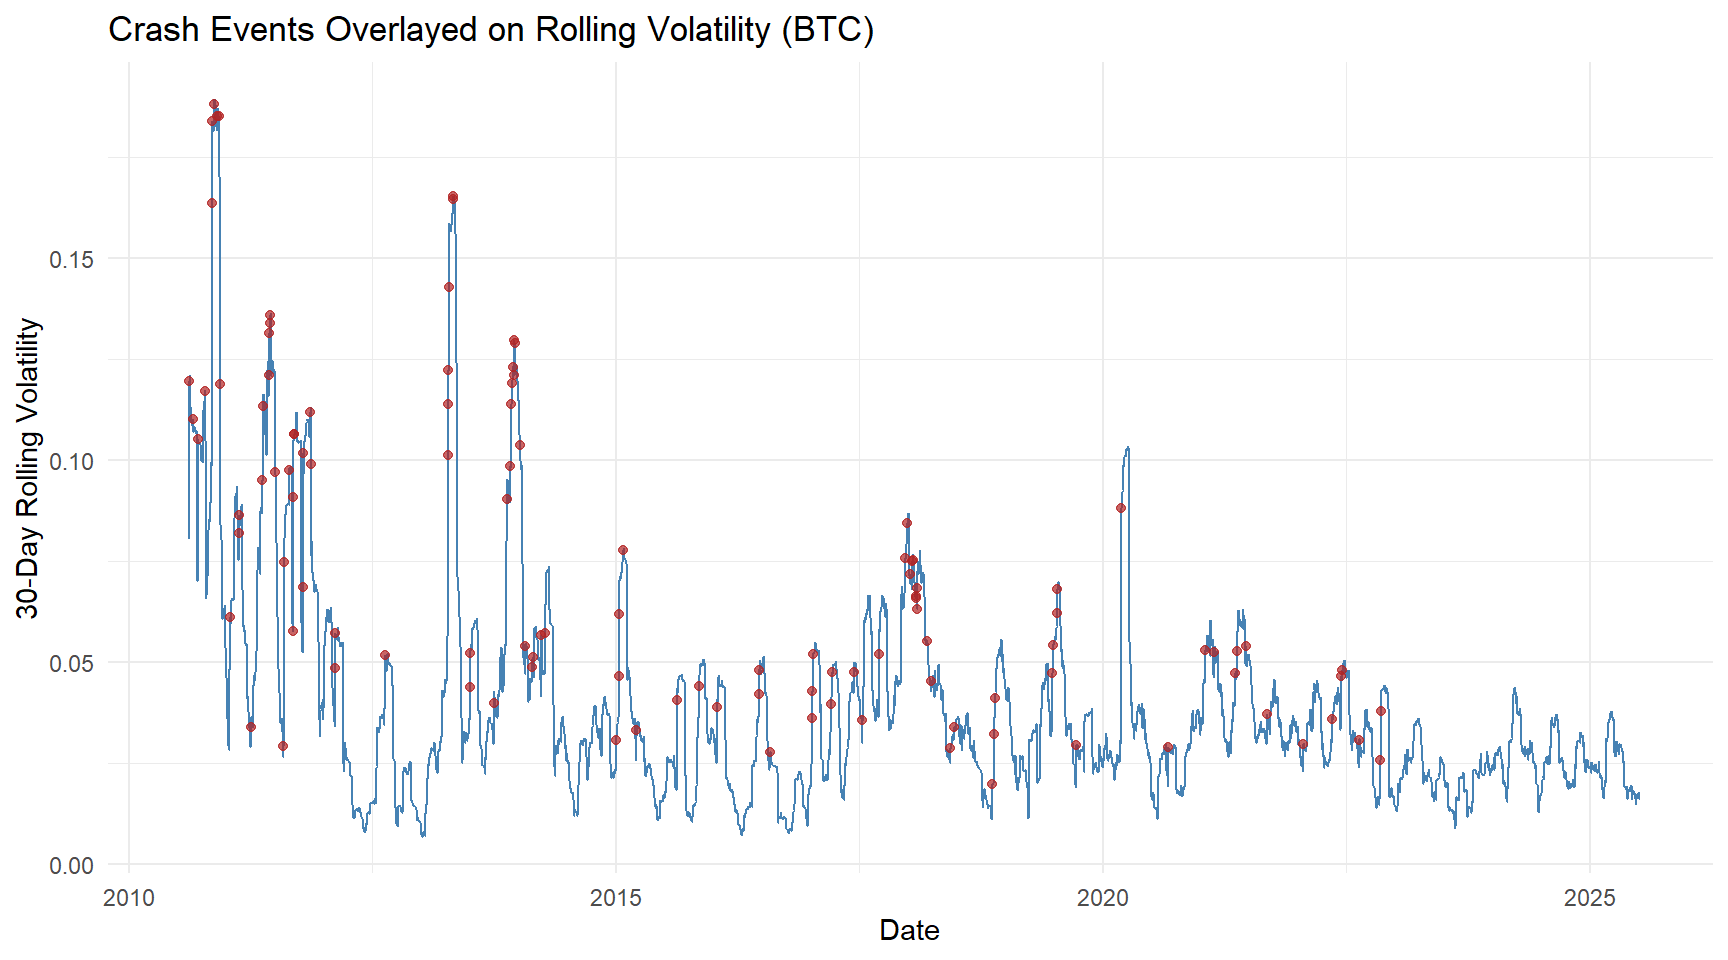
Crash events cluster around periods of elevated volatility, supporting regime-based risk modeling.
These results indicate that volatility regimes are not merely descriptive, but carry meaningful predictive information regarding downside risk.
To understand the potential for extreme price movements, we examined “tail events,” defined as unusually large positive or negative daily returns, for each cryptocurrency.
Extreme daily movements are relatively uncommon across all three cryptocurrencies, occurring on roughly 4–6% of days. Bitcoin experiences extreme events on about 4.4% of trading days, while Ethereum and BNB experience slightly more frequent extremes at 6.3% and 5.7%, respectively.
The plot shows how Bitcoin’s daily returns move over time.
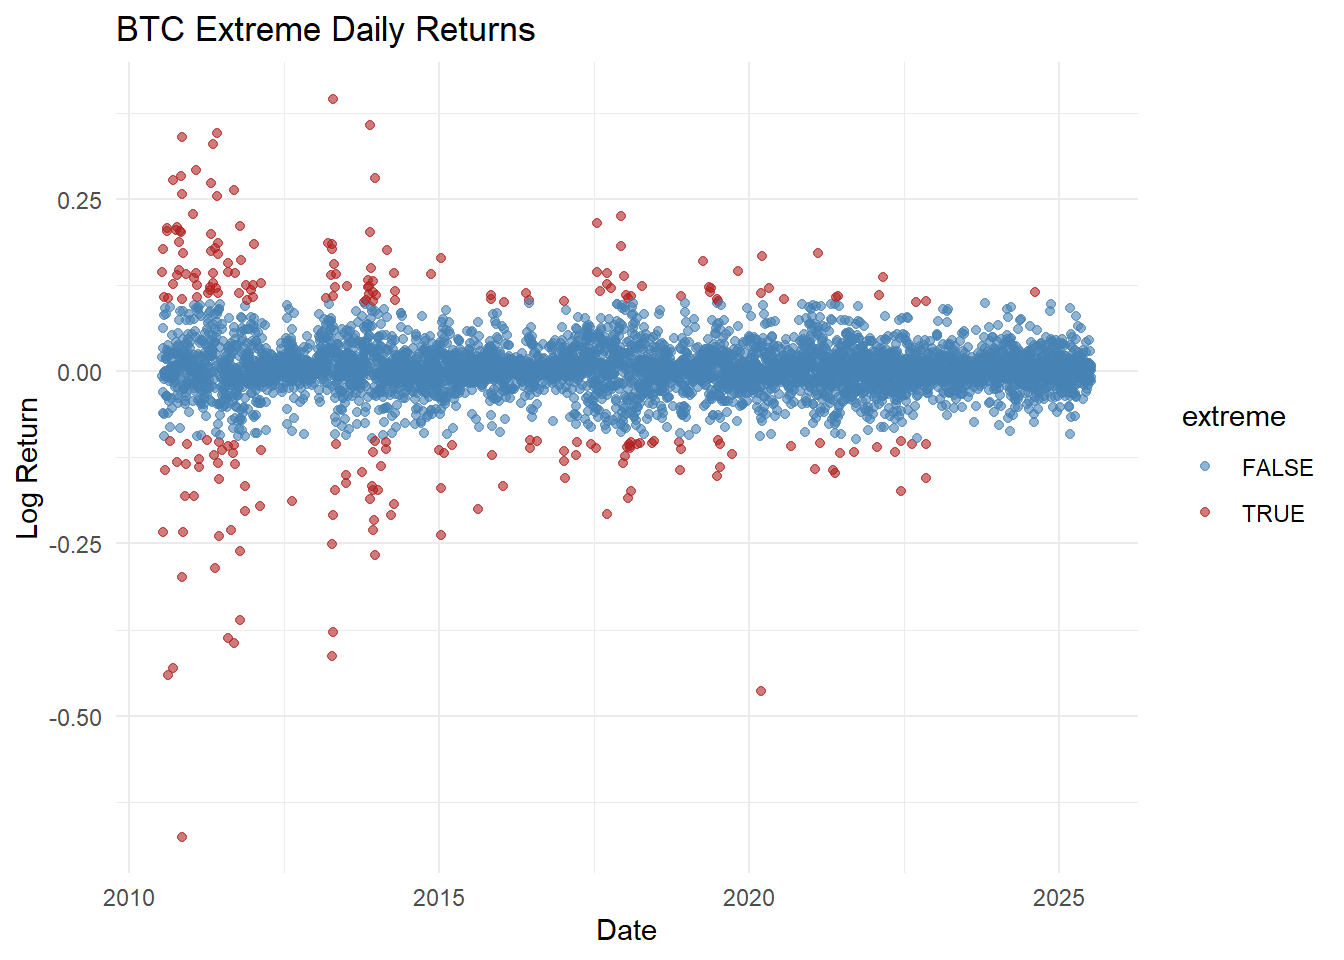
From the plot, you can see that extreme days are not evenly spread out — they tend to cluster during certain periods. This shows that Bitcoin sometimes experiences bursts of high volatility, where big losses or gains happen close together, rather than being random.
This helps investors understand when the market is more likely to experience big swings and why simple averages don’t tell the full story.
The QQ plot helps us see how daily cryptocurrency returns compare to a “normal” market. If returns were perfectly normal, the points would follow a straight line.
In reality, we see the points bend away at the edges — this shows extreme price swings happen more often than normal. Big drops are usually more common than big gains.
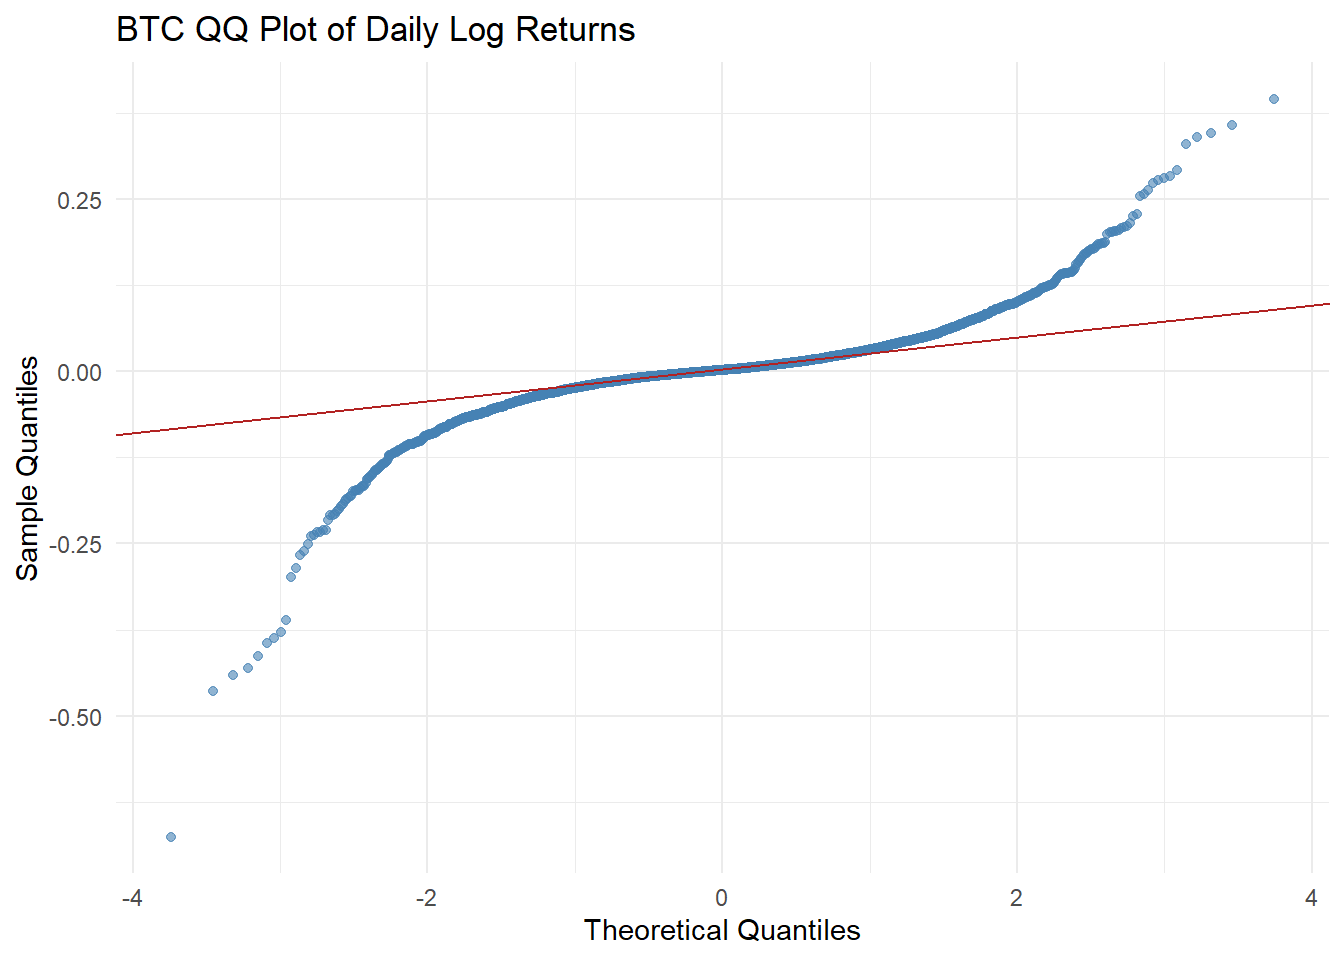
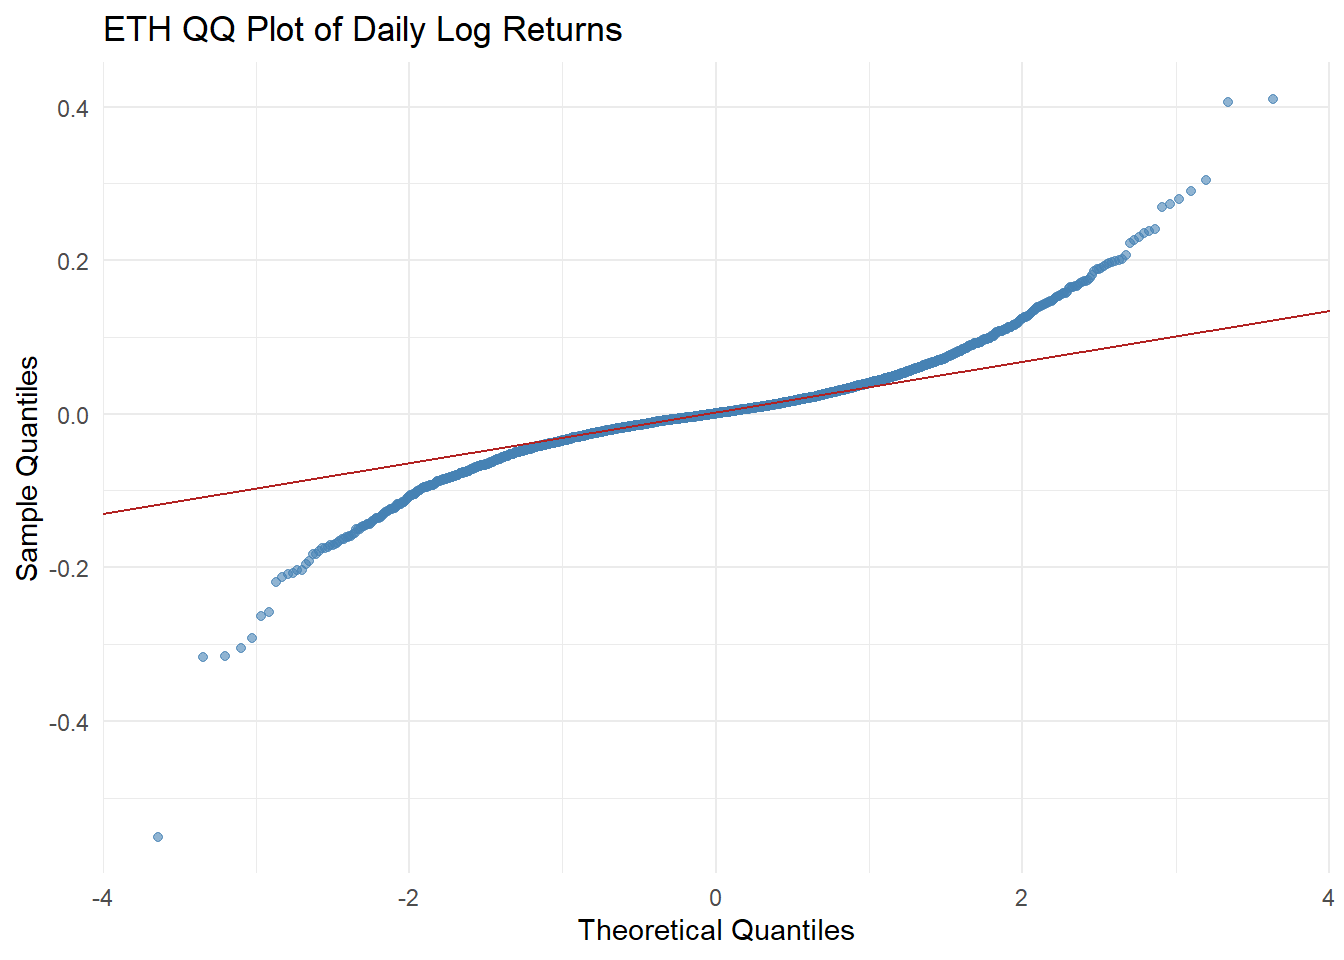
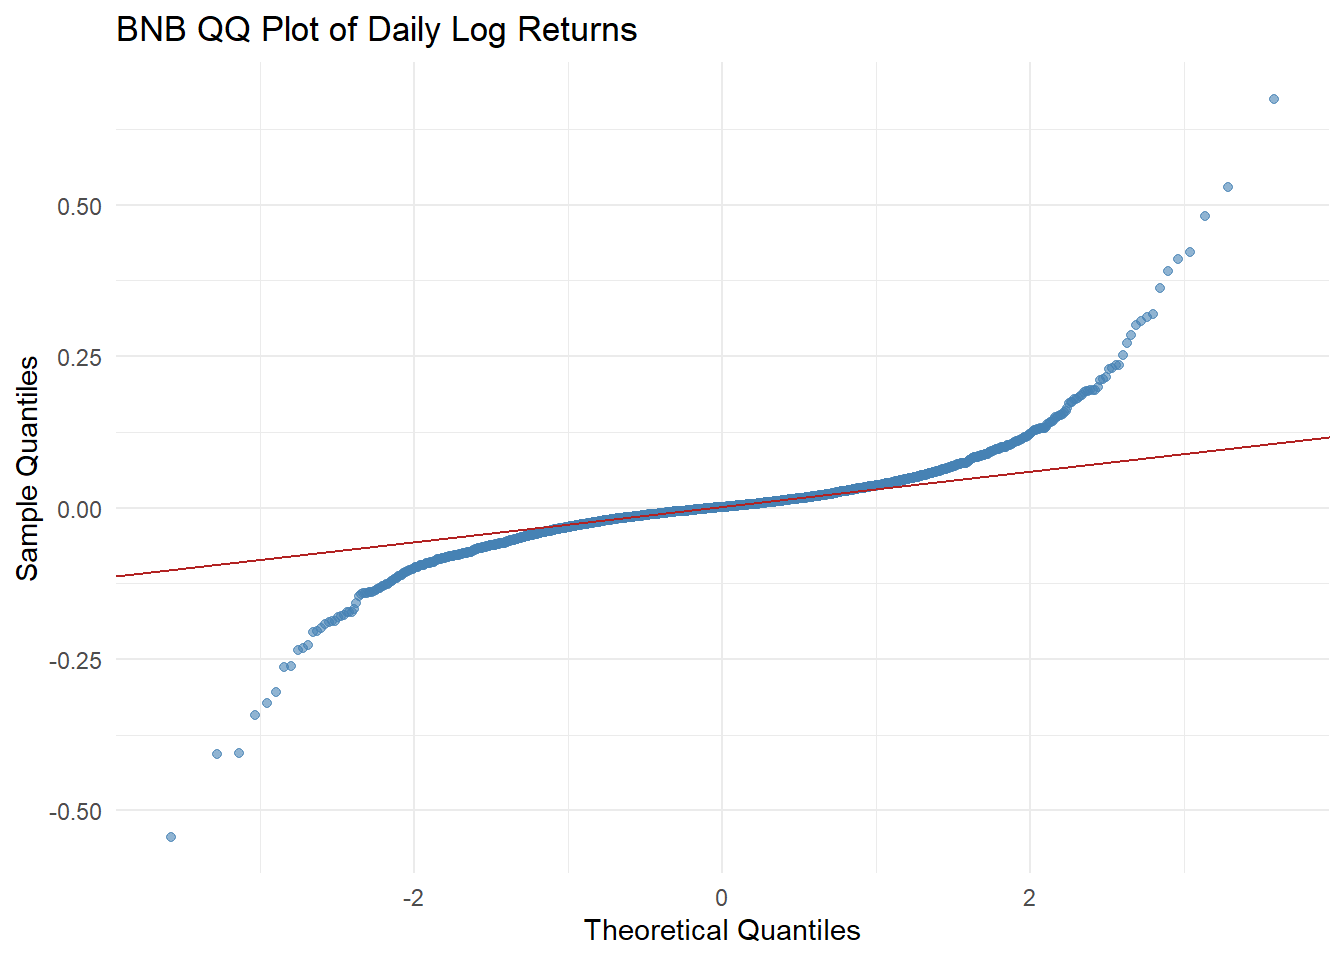
BTC is a bit more stable, while smaller coins like ETH and BNB have more extreme moves, meaning they’re riskier in volatile markets. This confirms why simple volatility isn’t enough to understand risk — we need to look at these extreme events too.
Tail risk metrics indicate that cryptocurrency prices can experience significant losses in a single day. On a typical bad day, losses may be noticeable, but in extreme situations, the losses can be substantially larger. This highlights that focusing only on average volatility underestimates the true downside risk.
In this project, Value at Risk (VaR) indicates that we could lose around 6% on a typical bad day, while Expected Shortfall (ES) shows that if losses exceed that, they could average as much as 11%. This highlights that extreme losses can be far larger than normal daily swings.
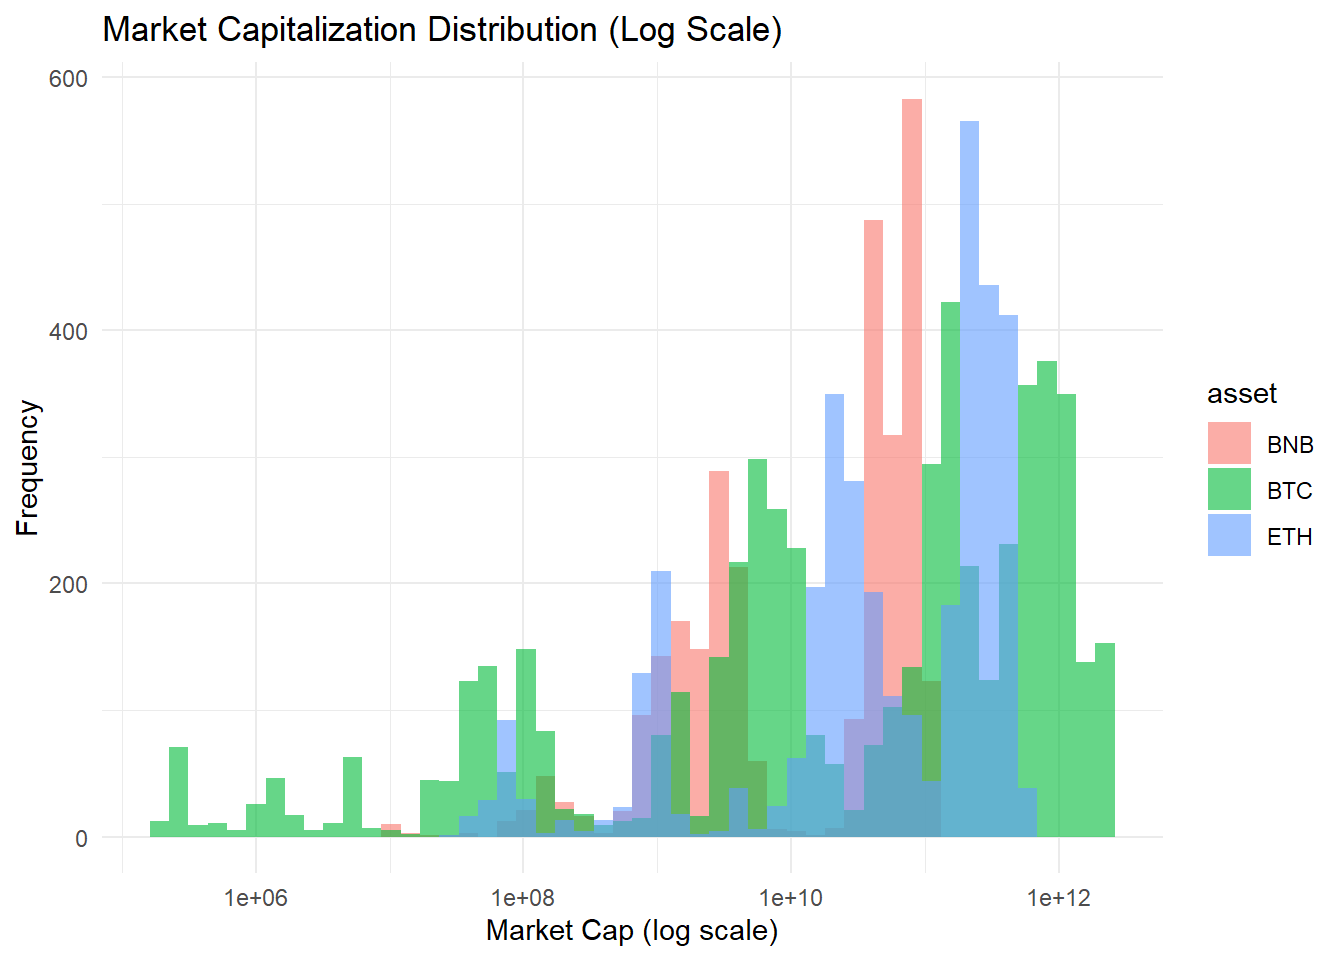
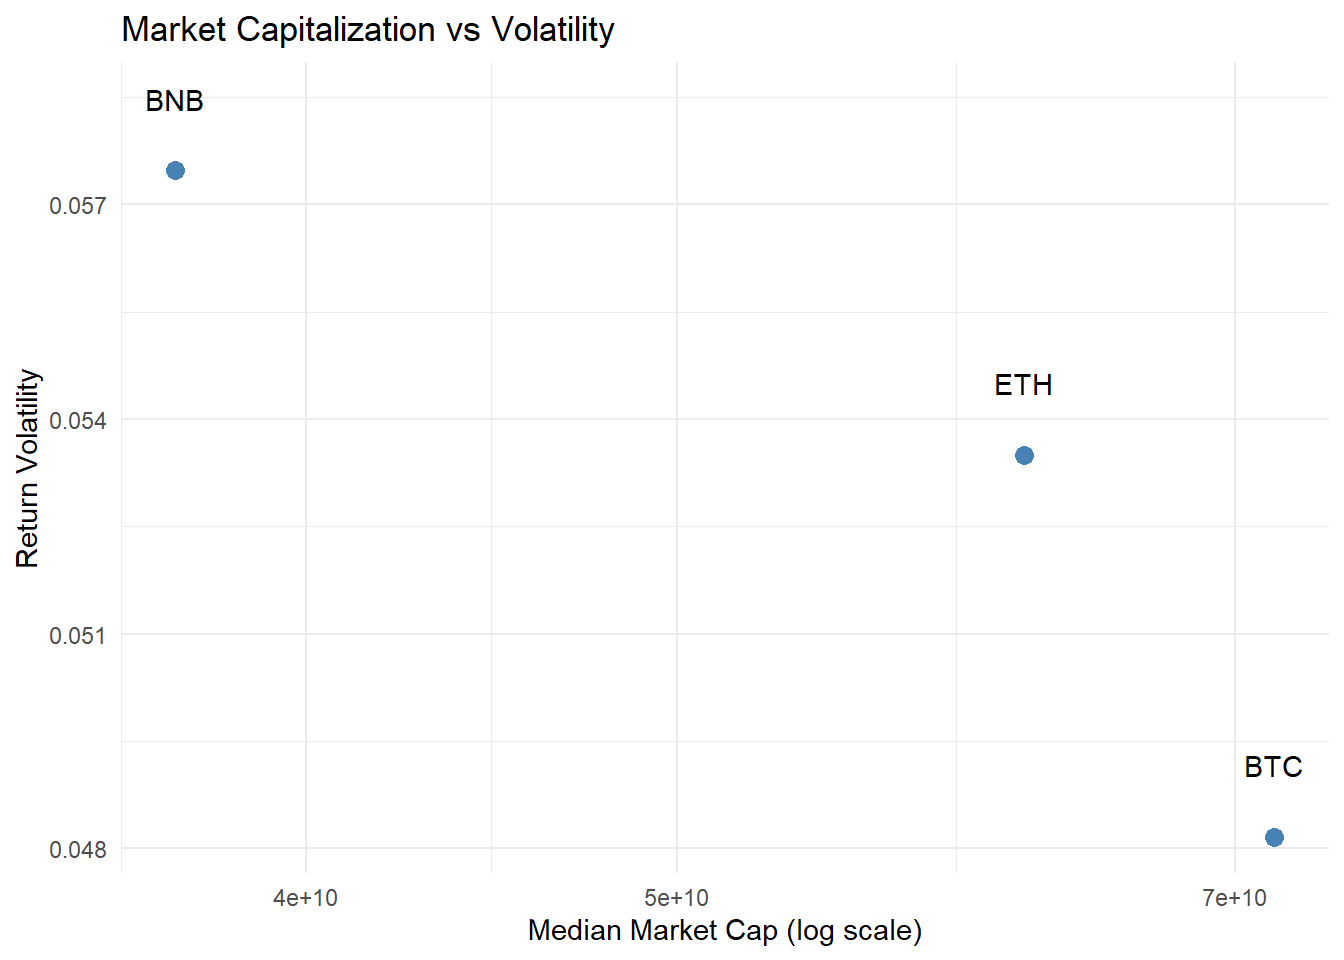
Market capitalization is often used as a proxy for liquidity, maturity, and systemic importance in cryptocurrency markets.
Larger-cap assets are generally perceived as more stable, while smaller-cap assets tend to exhibit higher volatility and crash risk.
We begin by examining the market size of major cryptocurrencies.
We can see that larger cryptocurrencies tend to have slightly lower average daily volatility. BTC, the largest coin by market cap, shows the smallest average swings, while smaller coins like BNB experience bigger daily ups and downs. This suggests that bigger market size generally provides some stability.
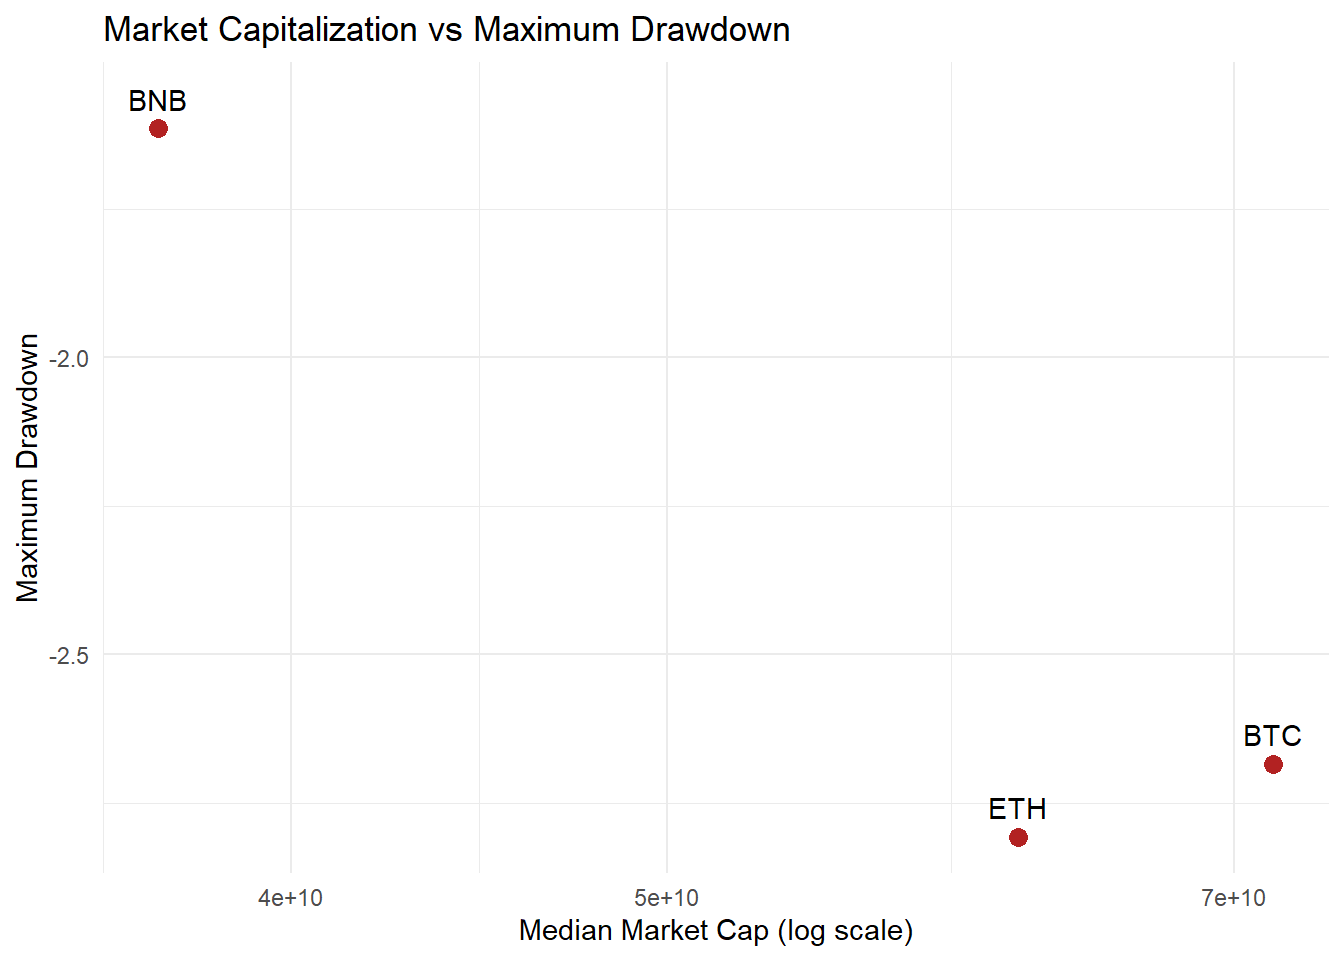
Looking at drawdowns, BTC and ETH have experienced more severe peak-to-trough losses compared to BNB, despite being larger in size. This reflects that large-cap coins are more exposed to market-wide crashes, while smaller coins may have less extreme cumulative drops over time.
💡Why This Benchmarking Matters?
Internal benchmarking avoids inappropriate cross-asset comparisons and provides a more realistic assessment of relative risk within the cryptocurrency ecosystem.
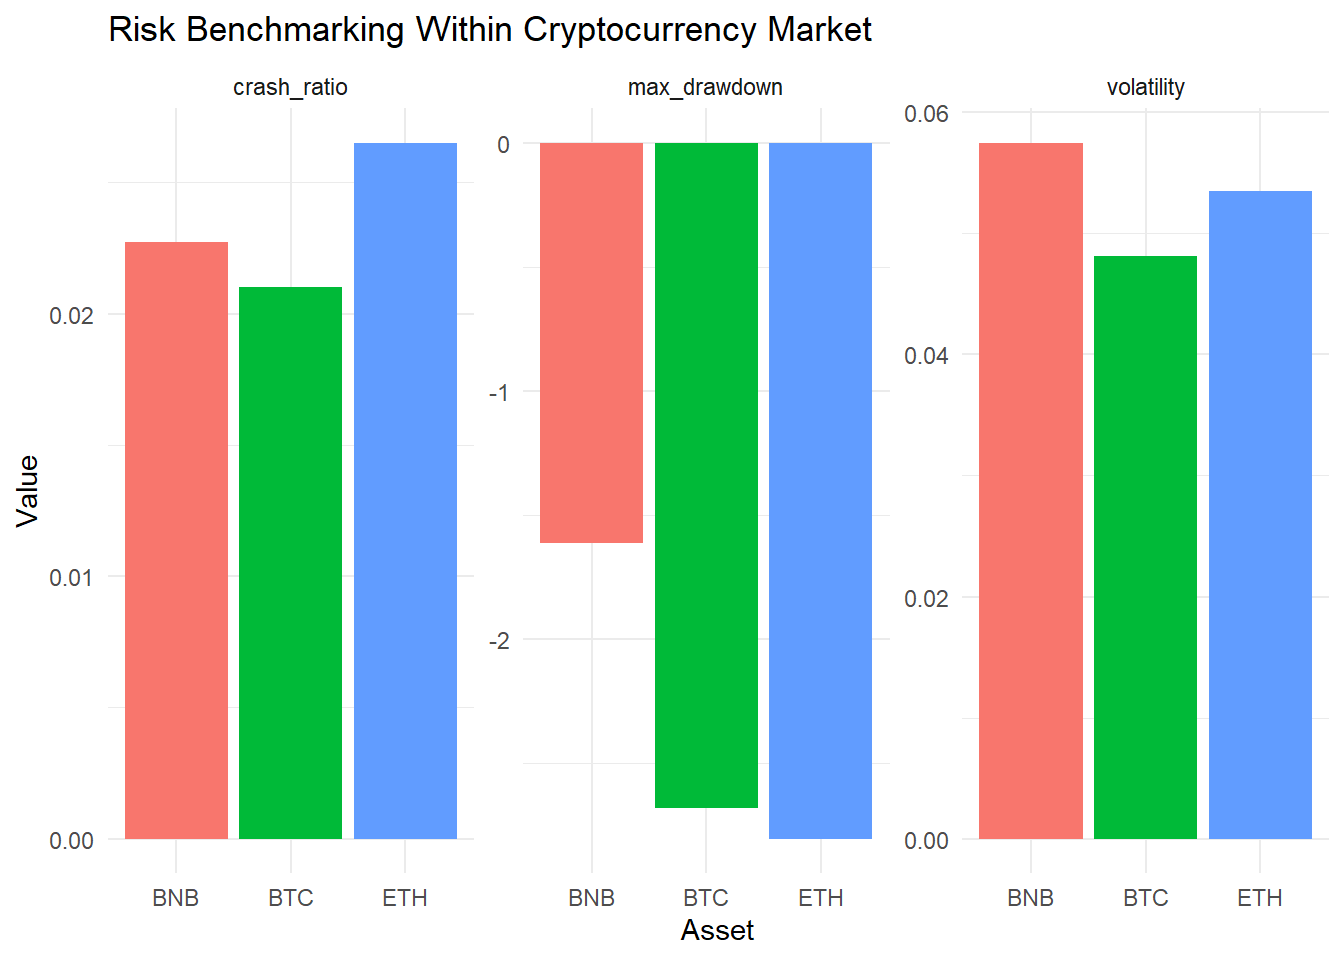
This plot summarizes risk characteristics for the three cryptocurrencies. BTC has the lowest daily price swings, ETH is a bit more volatile, and BNB has the highest volatility.
In terms of drawdowns, BTC and ETH have experienced larger peak-to-trough losses than BNB.
Looking at extreme single-day drops (crash ratio), ETH has slightly more frequent crashes, while BTC and BNB are similar.
Overall, bigger coins tend to move more steadily day-to-day but can still suffer large market-wide drops, whereas smaller coins fluctuate more often but their largest drops may be smaller.
This project examined the cryptocurrency market from 2010 to 2025, focusing on return behavior, volatility, risk, and market structure. We measured daily returns, tested whether returns are predictable or stationary, and modeled volatility using ARIMA and GARCH approaches. We also identified high- and low-volatility regimes, measured drawdowns and crash risks, analyzed extreme returns and tail risks, and compared market capitalization across major coins.
🎯Key insights include:
Overall, these analyses show that understanding both daily volatility and extreme events is critical for portfolio risk management and strategic investment decisions in cryptocurrencies.
✨Please review the dataset details and code, and feel free to interact with the Shiny app:
・Shiny (HF Space): Crypto Market Dynamics 🪙 Explore crypto returns, volatility & risk
・GitHub: github.com/JYUN-YI/crypto-market-dynamics
・Data Source: Kaggle - Crypto_coins_dataset (2010-2025)